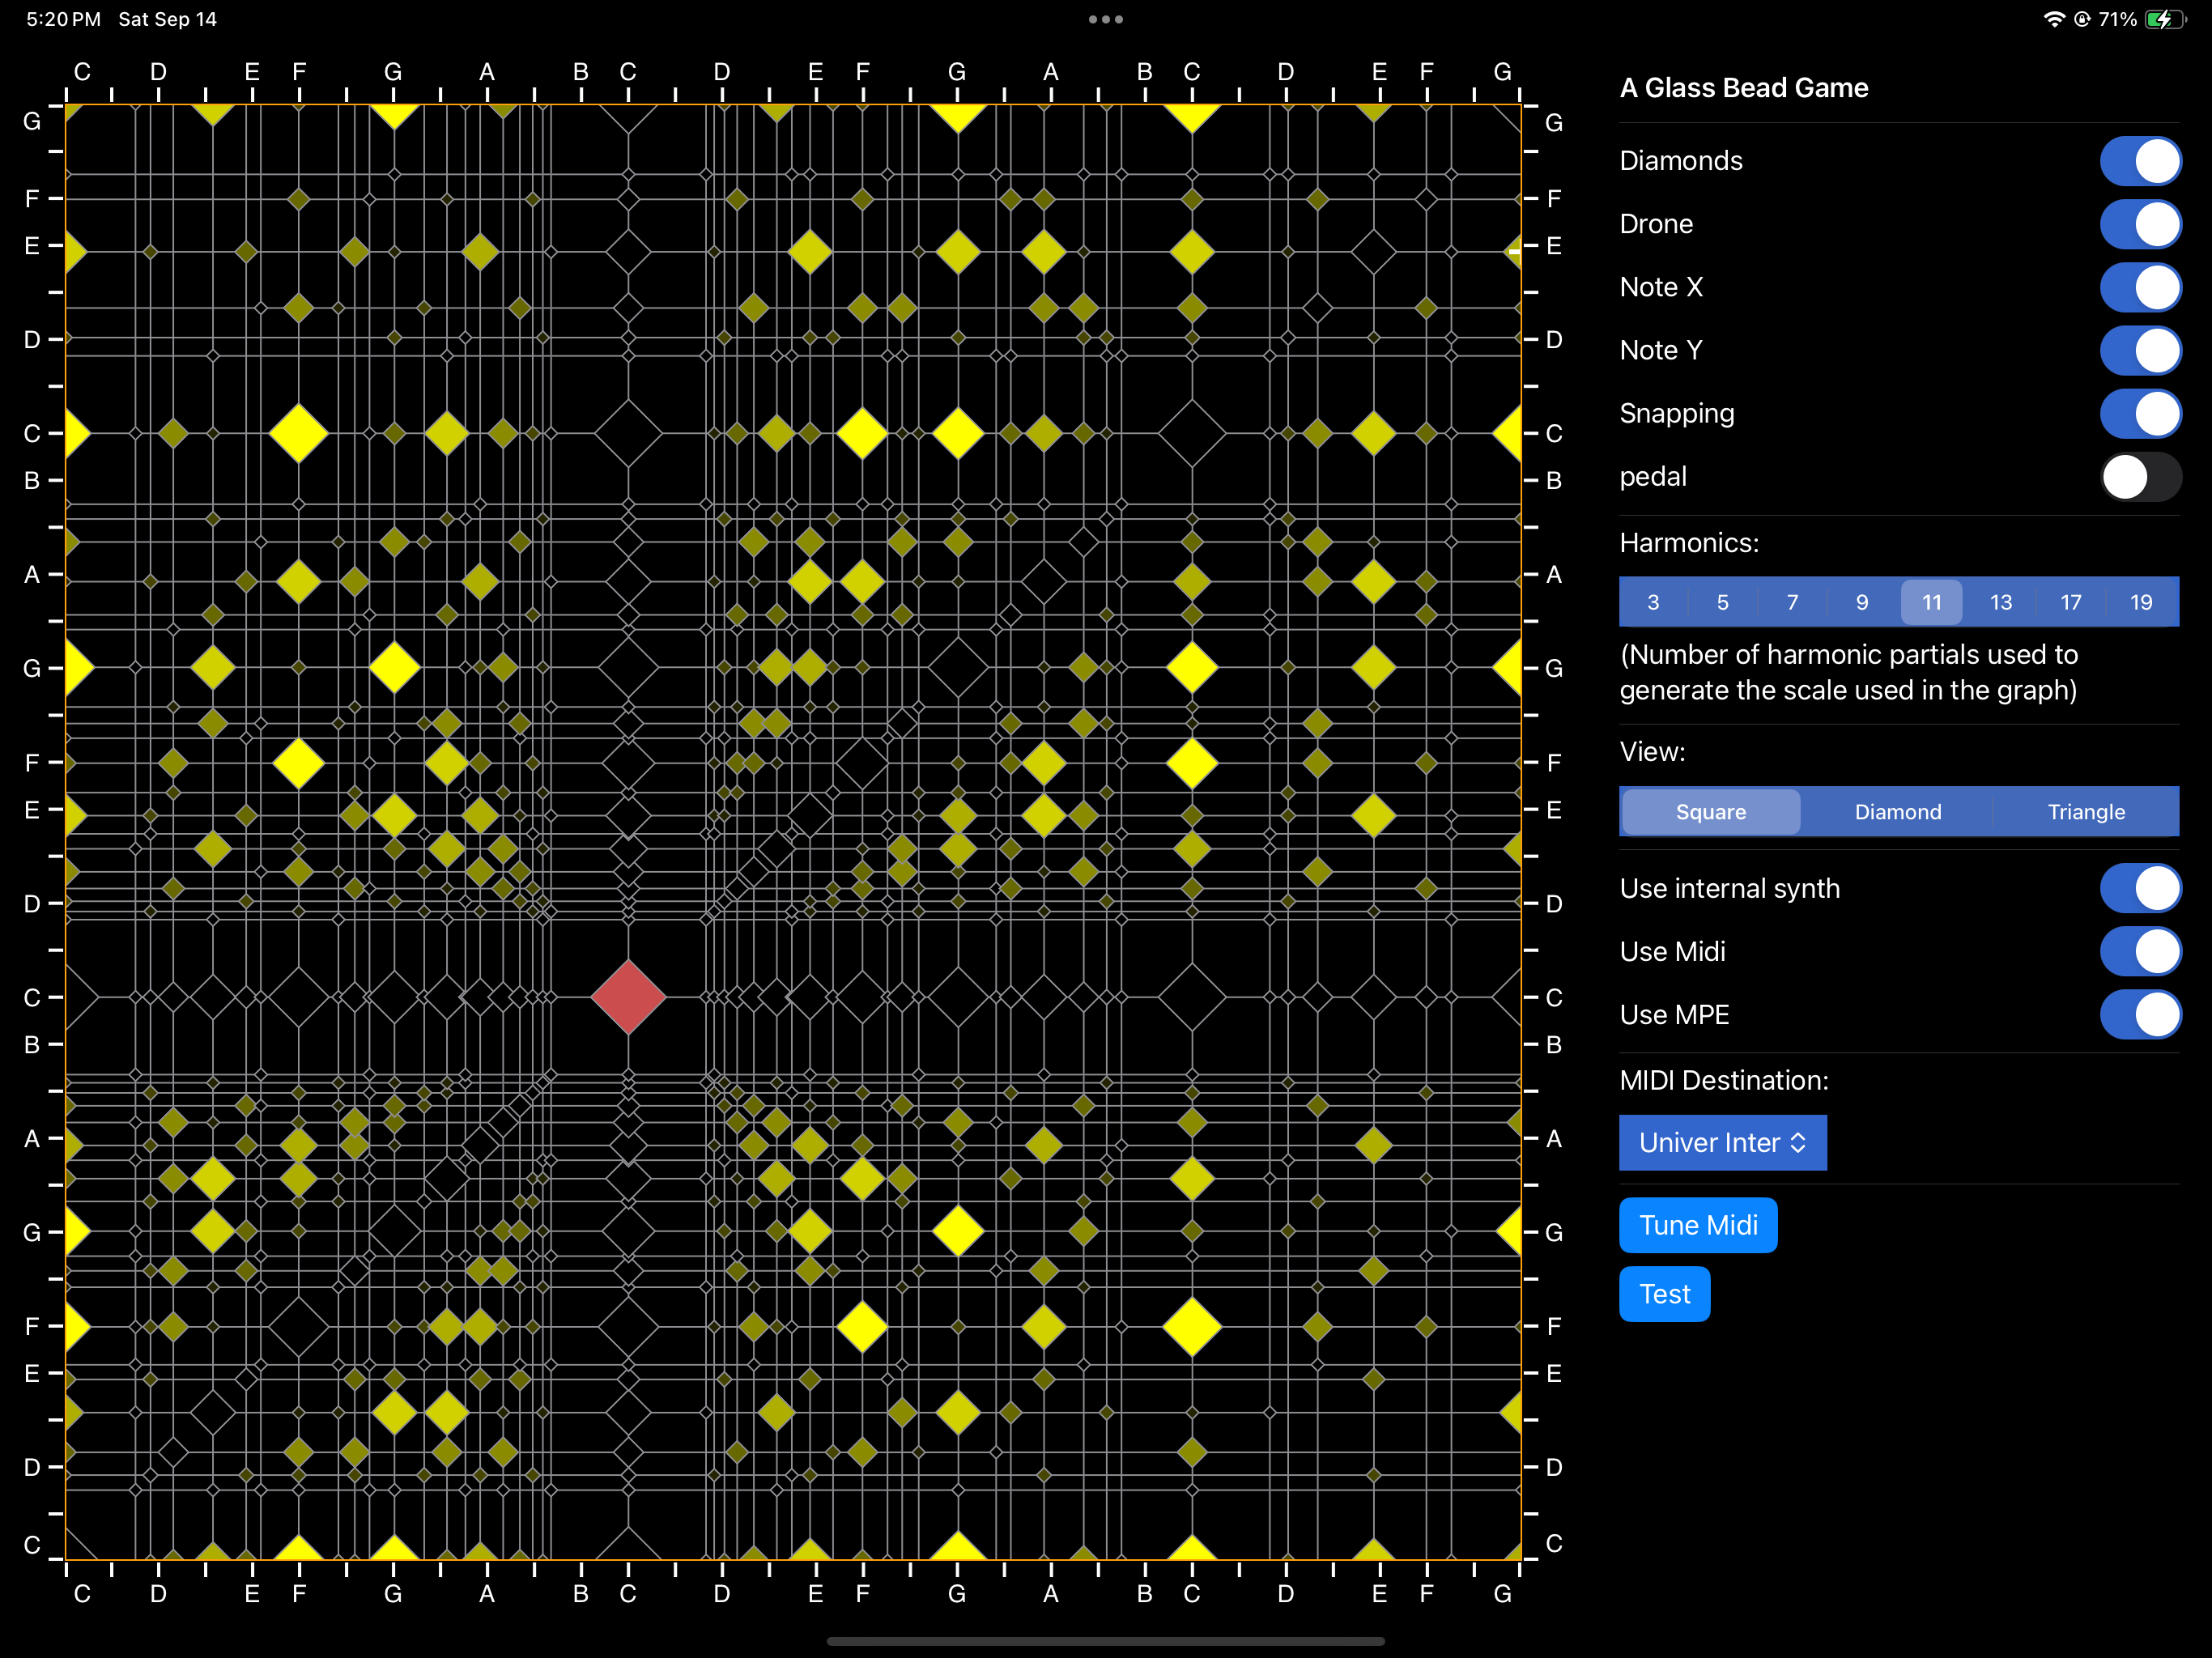
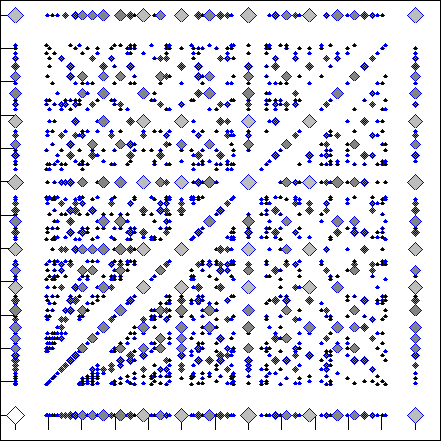
An app for visualizing consonance and dissonance Download: iPad and Mac app via the Apple Store The main screen of “A Glass Bead Game” The graph Each axis of the graph above represents the frequency of a musical tone across the span of two and a half octaves. The tick-marks along these axes represent one semitone of pitch change, and note names representing a diatonic scale in C is added for reference. The horizontal and vertical lines of the graph represent intervals of a “just intoned” musical scale where the moving tone forms a consonance compared to a static drone tone, as is described in the page An Atlas of Consonance. The diamonds are points in the graph where the two moving tones and the drone all form consonances with each other. Every possible arrangement of 3 notes (a chord) is represented as a point on this graph. ...